There’s a curious thing about unlikely independent events: no matter how rare, they’re most likely to happen right away.
Let’s get hypothetical
You’ve taken a bet that pays off if you guess the exact date of the next occurrence of a rare event (p = 0.0001 on any given day i.i.d). What day do you choose? In other words, what is the most likely day for this rare event to occur?
Setting aside for now why in the world you’ve taken such a silly sounding bet, it would seem as though a reasonable way to think about it would be to ask: what is the expected number of days until the event? That must be the best bet, right?
We can work out the expected number of days quite easily as 1/p = 10000. So using the logic of expectation, we would choose day 10000 as our bet.
Let’s simulate to see how often we would win with this strategy. We’ll simulate the outcomes by flipping a weighted coin until it comes out heads. We’ll do this 100,000 times and record how many flips it took each time.
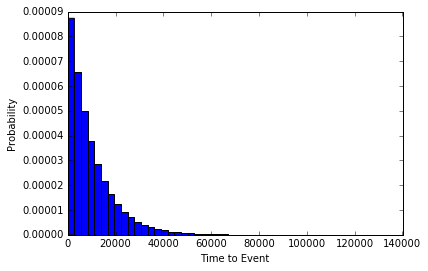
The event occurred on day 10,000 exactly 35 times. However, if we look at a histogram of our simulation experiment, we can see that the time it took for the rare event to happen was more often short, than long. In fact, the event occurred 103 times on the very first flip (the most common Time to Event in our set)!
So from the experiment it would seem that the most likely amount of time to pass until the rare event occurs is 0. Maybe our hypothetical event was just not rare enough. Let’s try it again with p=0.0000001, or an event with a 1 in 1million chance of occurring each day.

While now our event is extremely unlikely to occur, it’s still most likely to occur right away.
Existential Risk
What does this all have to do with seizing the day? Everything we do in a given day comes with some degree of risk. The Stanford professor Ronald A. Howard conceived of a way of measuring the riskiness of various day-to-day activities, which he termed the micromort. One micromort is a unit of risk equal to p = 0.000001 (1 in a million chance) of death. We are all subject to a baseline level of risk in micromorts, and additional activities may add or subtract from that level (skiing, for instance adds 0.7 micromorts per day).
While minimizing the risks we assume in our day-to-day lives can increase our expected life span, the most likely exact day of our demise is always our next one. So carpe diem!!
Post Script:
Don’t get too freaked out by all of this. It’s just a bit of fun that comes from viewing the problem in a very specific way. That is, as a question of which exact day is most likely. The much more natural way to view it is to ask, what is the relative probability of the unlikely event occurring tomorrow vs any other day but tomorrow. I leave it to the reader to confirm that for events with p < 0.5, the latter is always more likely.


