Time-series forecasting: Bike Accidents

About a year ago I posted this video visualization of all the reported accidents involving bicycles in Montreal between 2006 and 2010. In the process I also calculated and plotted the accident rate using a monthly moving average. The results followed a pattern that was for the most part to be expected. The rate shoots up in the spring, and declines to only a handful during the winter months.

It’s now 2013 and unfortunately our data ends in 2010. However, the pattern does seem to be quite regular (that is, exhibits annual periodicity) so I decided to have a go at forecasting the time series for the missing years. I used a seasonal decomposition of time series by LOESS to accomplish this.

You can see the code on github but here are the results. First, I looked at the four components of the decomposition:

decomp_collisions

Indeed the seasonal component is quite regular and does contain the intriguing dip in the middle of the summer that I mentioned in the first post.

seasonal_collisions


This figure shows just the seasonal deviation from the average rates. The peaks seem to be early July and again in late September. Before doing any seasonal aggregation I thought that the mid-summer dip may correspond with the mid-August construction holiday, however it looks now like it is a broader summer-long reprieve. It could be a population wide vacation effect.

Finally, I used an exponential smoothing model to project the accident rates into the 2011-2013 seasons.

forecast_collisions

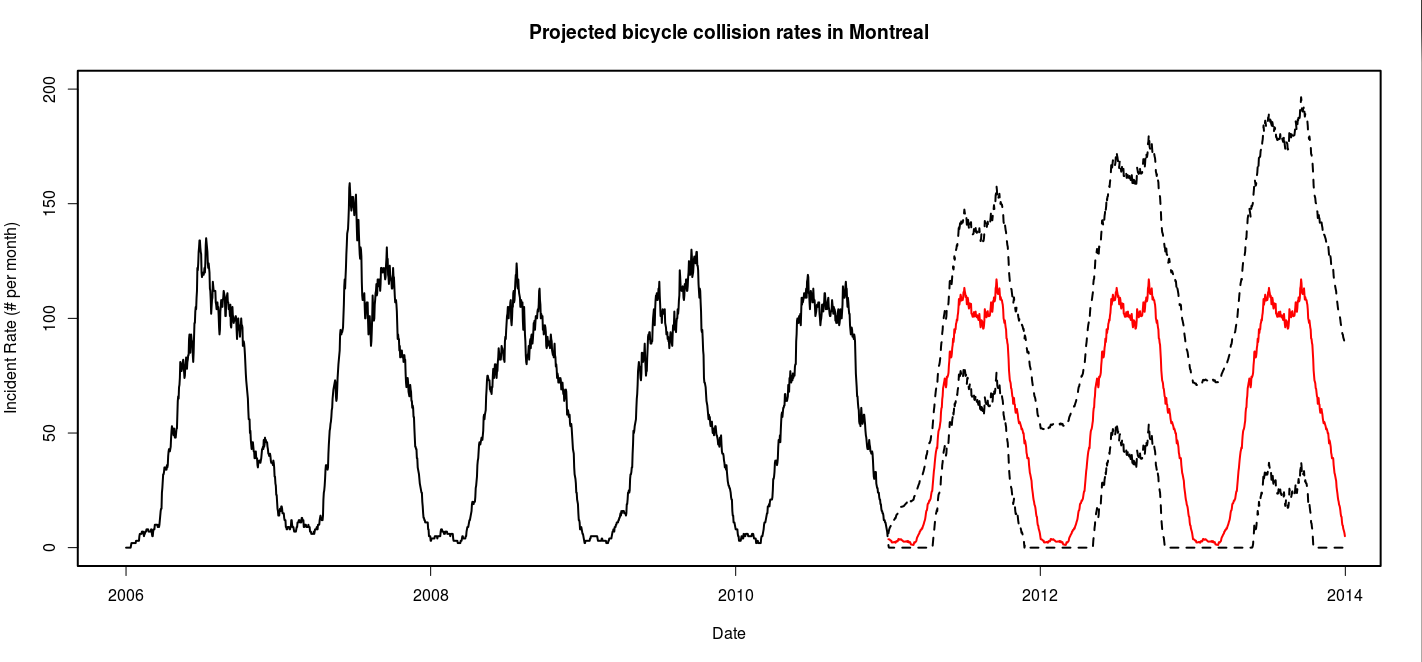
It would be great to get the data from these years to validate the forecast, but for now lets just hope that we’re not pushing up against those upper confidence bounds.

Advertisement

Observing Dark Worlds – Visualizing dark matter’s distorting effect on galaxies

Some people like to do crossword puzzles. I like to do machine learning puzzles.

Lucky for me, a new contest was just posted yesterday on Kaggle. So naturally, my lazy Saturday was spent getting elbow deep into the data.

The training set consists of a series of ‘skies’, each containing a bunch of galaxies. Normally, these galaxies would exhibit random ellipticity. That is, if it weren’t for all that dark matter out there! The dark matter, while itself invisible (it is dark after all), tends to aggregate and do some pretty funky stuff. These aggregations of dark matter produce massive halos which bend the heck out of spacetime itself! The result is that any galaxies behind these halos (from our perspective here on earth) appear contorted around the halo.

The tricky bit is to distinguish between the background noise in the ellipticity of galaxies, and the regular effect of the dark matter halos. How hard could it be?

Step one, as always, is to have a look at what you’re working with using some visualization.

An example of the training data. This sky has 3 dark matter halos. I f you squint, you can kind of see the effect on the ellipticity of the surrounding galaxies.

If you want to try it yourself, I’ve posted the code here.

If you don’t feel like running it yourself, here are all 300 skies from the training set.


Now for the simple matter of the predictions. Looks like Sunday will be a fun day too! Stay tuned…