About a year ago I posted this video visualization of all the reported accidents involving bicycles in Montreal between 2006 and 2010. In the process I also calculated and plotted the accident rate using a monthly moving average. The results followed a pattern that was for the most part to be expected. The rate shoots up in the spring, and declines to only a handful during the winter months.
It’s now 2013 and unfortunately our data ends in 2010. However, the pattern does seem to be quite regular (that is, exhibits annual periodicity) so I decided to have a go at forecasting the time series for the missing years. I used a seasonal decomposition of time series by LOESS to accomplish this.
You can see the code on github but here are the results. First, I looked at the four components of the decomposition:

Indeed the seasonal component is quite regular and does contain the intriguing dip in the middle of the summer that I mentioned in the first post.

This figure shows just the seasonal deviation from the average rates. The peaks seem to be early July and again in late September. Before doing any seasonal aggregation I thought that the mid-summer dip may correspond with the mid-August construction holiday, however it looks now like it is a broader summer-long reprieve. It could be a population wide vacation effect.
Finally, I used an exponential smoothing model to project the accident rates into the 2011-2013 seasons.
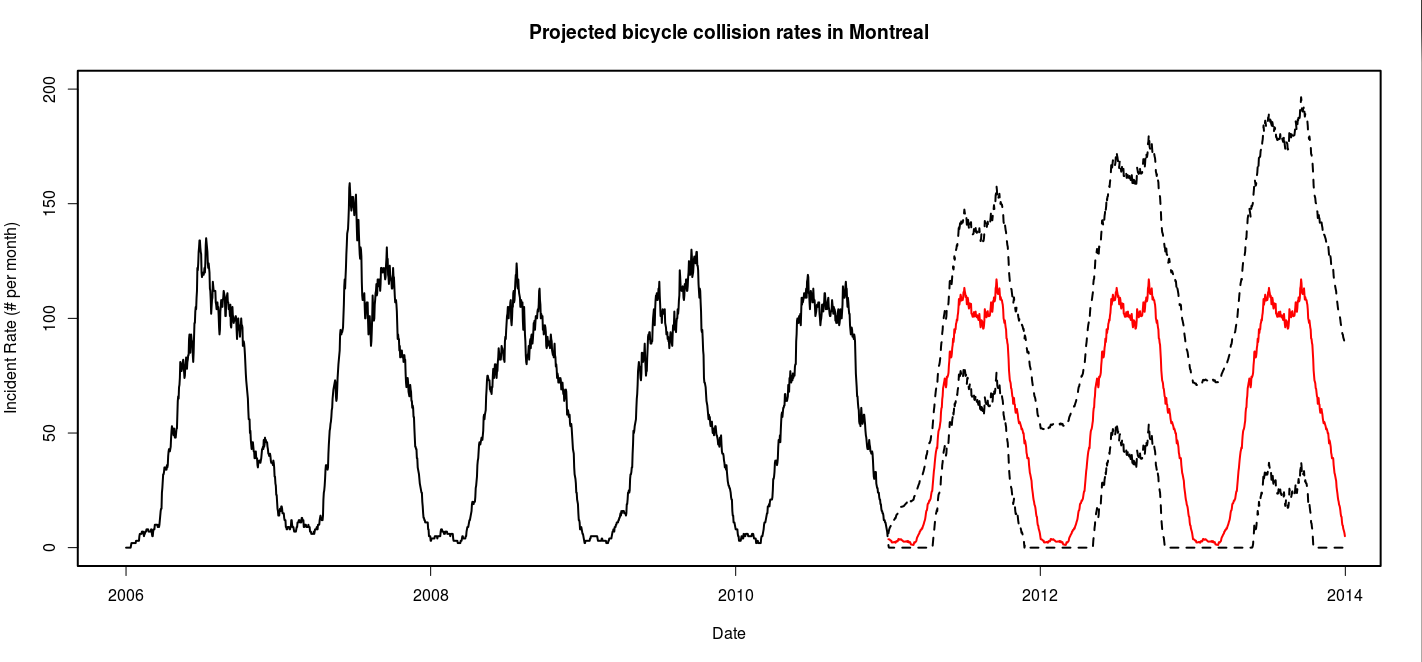
It would be great to get the data from these years to validate the forecast, but for now lets just hope that we’re not pushing up against those upper confidence bounds.

You could validate your projections by removing from your dataset years 2009 and 2010, run your projection again and compare projections for 2009 and 2010 versus the actual data. 🙂
I think what you’re seeing isn’t a dip, but two peaks. The first caused by a surge in new/returning cyclists as the weather improves, this then tails off as best intentions fall by the wayside. The second caused by students returning, reducing as the nights draw in and the weather deteriorates.
Many thanks for sharing! It was a lot of fun following along at home! Being unfamiliar with the maptools package, I am having problems getting readShapePoly() to work correctly, but I think it has something to do with the function not being aware of some kind of metadata contained within the montreal_borough_borders.dbf and the montreal_borough_borders.shx files. I think I need to sit and spend some time with the maptools documentation. 🙂
Pingback: importing data into R directly from a Github repository | failuretoconverge
Dr Chivers, great post! I have a couple of similar problems, which I’ll now try this on. I wonder if you know of any Bayesian-like extensions for STL or loess in general …. References suffice. I’m thinking that an empirical model for the remainder might be used in place of the sampling function, as kinda done in the DPpackage, and this used to calculate Bayes factors for different years, to adopt the schema of the problem you posed. Two of my problems are environmentally-related: (1) We are locally monitoring energy consumption at schools with a lot of good data, and are interested in piecing out both behaviors that can be modified, and effects of “treatments”, namely policy changes. (2) Harder, we have data on trash and recycling tonnage over time, by collection routes, and recently enacted a single stream plan. Would like to study before/after on the plan, as well as behaviors pertaining to holiday trash versus others. Alas, also have some data collection and accuracy issues post-implementation, and I’m hoping the good data in hand before implementation will help sort those out.
The third problem is a research problem I’m looking at for my employer, which involves Internet activity data, but it’s too complicated to explain in this space.